
What do families actually pay for youth hockey – and how does your club compare?
If you’ve asked these questions recently, you’re not alone. To bring some clarity, we analyzed nearly ten years of registration data from youth hockey organizations using Crossbar, a PlayMetrics company and a leading platform for youth hockey registration and management, across the United States.
This isn't a full industry report, and we won't pretend it is. But it is a useful snapshot – something you can use to gut-check your pricing, understand your position within your tier and region, and support strategy discussions with your staff and board.
Here’s what we found:
- The gap between Tier 1 and Tier 2 pricing is substantial.
- Age groups don’t scale as predictably as you might assume.
- The states with the highest fees aren’t necessarily the ones most people expect.
We also see a clear post-pandemic rebound that reshaped the financial landscape of youth hockey in ways still unfolding today.
Let’s dig in.
Three Periods of Change Across a Decade of Fees
Across the past ten years, youth hockey fees have followed a clear three-period pattern, each defined by its own dynamics.
2015–2020: Steady Growth
Fees increased gradually each season as clubs made routine adjustments for staffing, ice time, and operational expenses. Changes were modest and predictable enough for stable long-term planning.
2020–2022: Pandemic Disruption
The pandemic brought shortened seasons, reduced travel, and significant changes to programs. Average fees dropped nearly 20% as participation shifted and clubs adapted to widespread restrictions.
2022–Present: Sharp Rebound
Fees rose quickly – nearly 60% in three years. Most of the decade’s total increase occurred during this period as clubs rebuilt programming, restored staffing, and adjusted to higher operating costs. And this trend isn’t limited to hockey. Across all youth sports, rising expenses have become a defining pressure point. In fact, findings from the Future of Youth Sports Predictions Report show that 84% of clubs surveyed across all sports expect to increase membership fees in the coming seasons.
When you're planning 2026-27 pricing, you're operating in an environment where families have likely experienced cost increases across all their children's activities.
How Tier 1 and Tier 2 Costs Compare
Youth hockey operates in two distinct competitive environments, and the financial realities of each differ significantly.
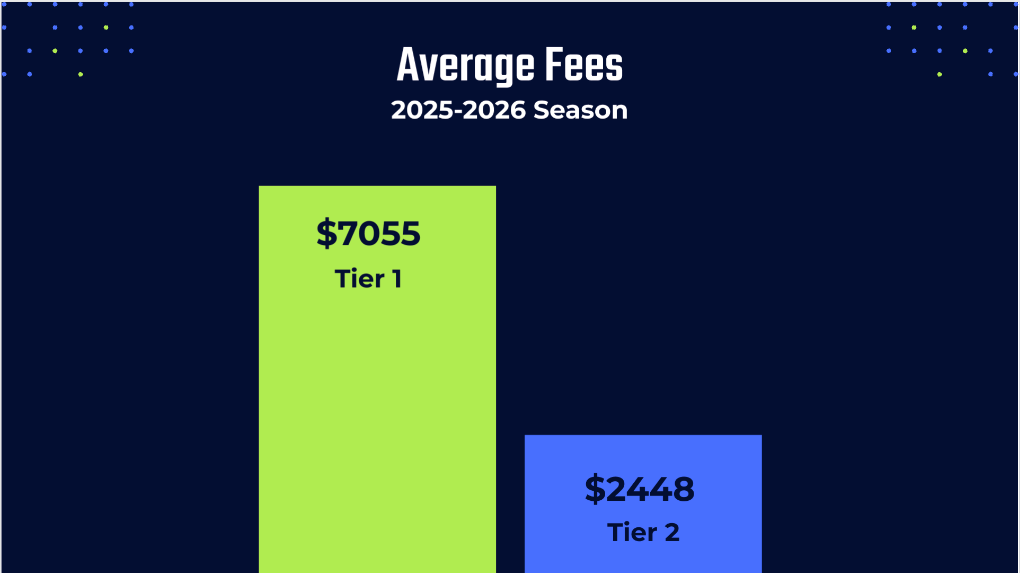
- Tier 2 programs – where most youth hockey athletes play – averaged $2,448 for the 2025 season.
- Tier 1 programs averaged $7,055, reflecting the higher travel demands, expanded competition schedules, and specialized development environments typical of AAA hockey.
The cost gap between the two tiers now exceeds
$4,600 per season.
Looking across the decade within this dataset, the long-view shows the same upward direction for both tiers:
- Tier 1 fees rose by about 36.4% from the earliest to the latest season.
- Tier 2 fees rose by roughly 62.6% over the same span.
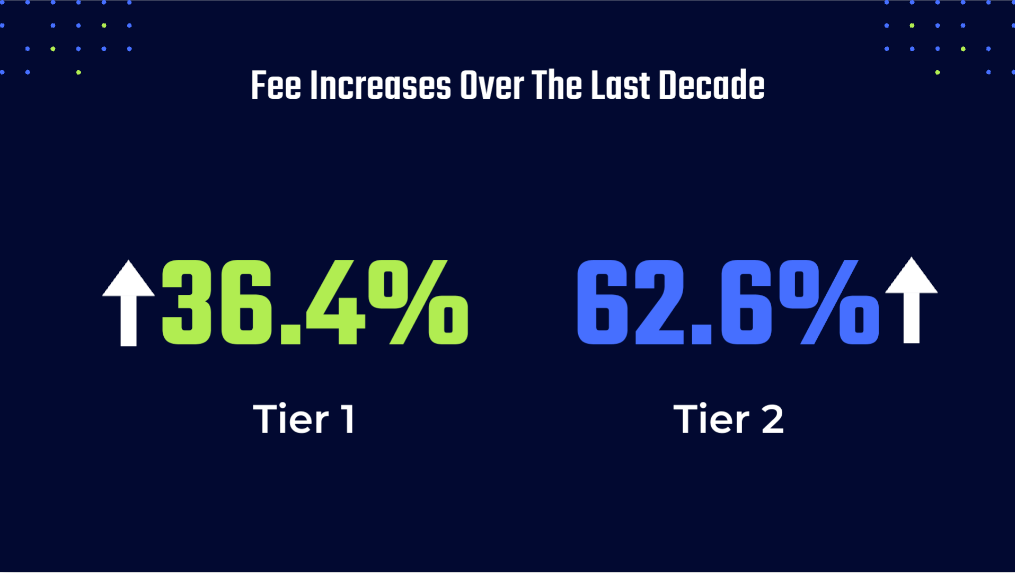
These figures aren’t from a fixed panel of the same clubs year over year, so they should be interpreted as directional rather than definitive. But the trend line is clear: both tiers have become more expensive over time, and the financial distance between them remains substantial.
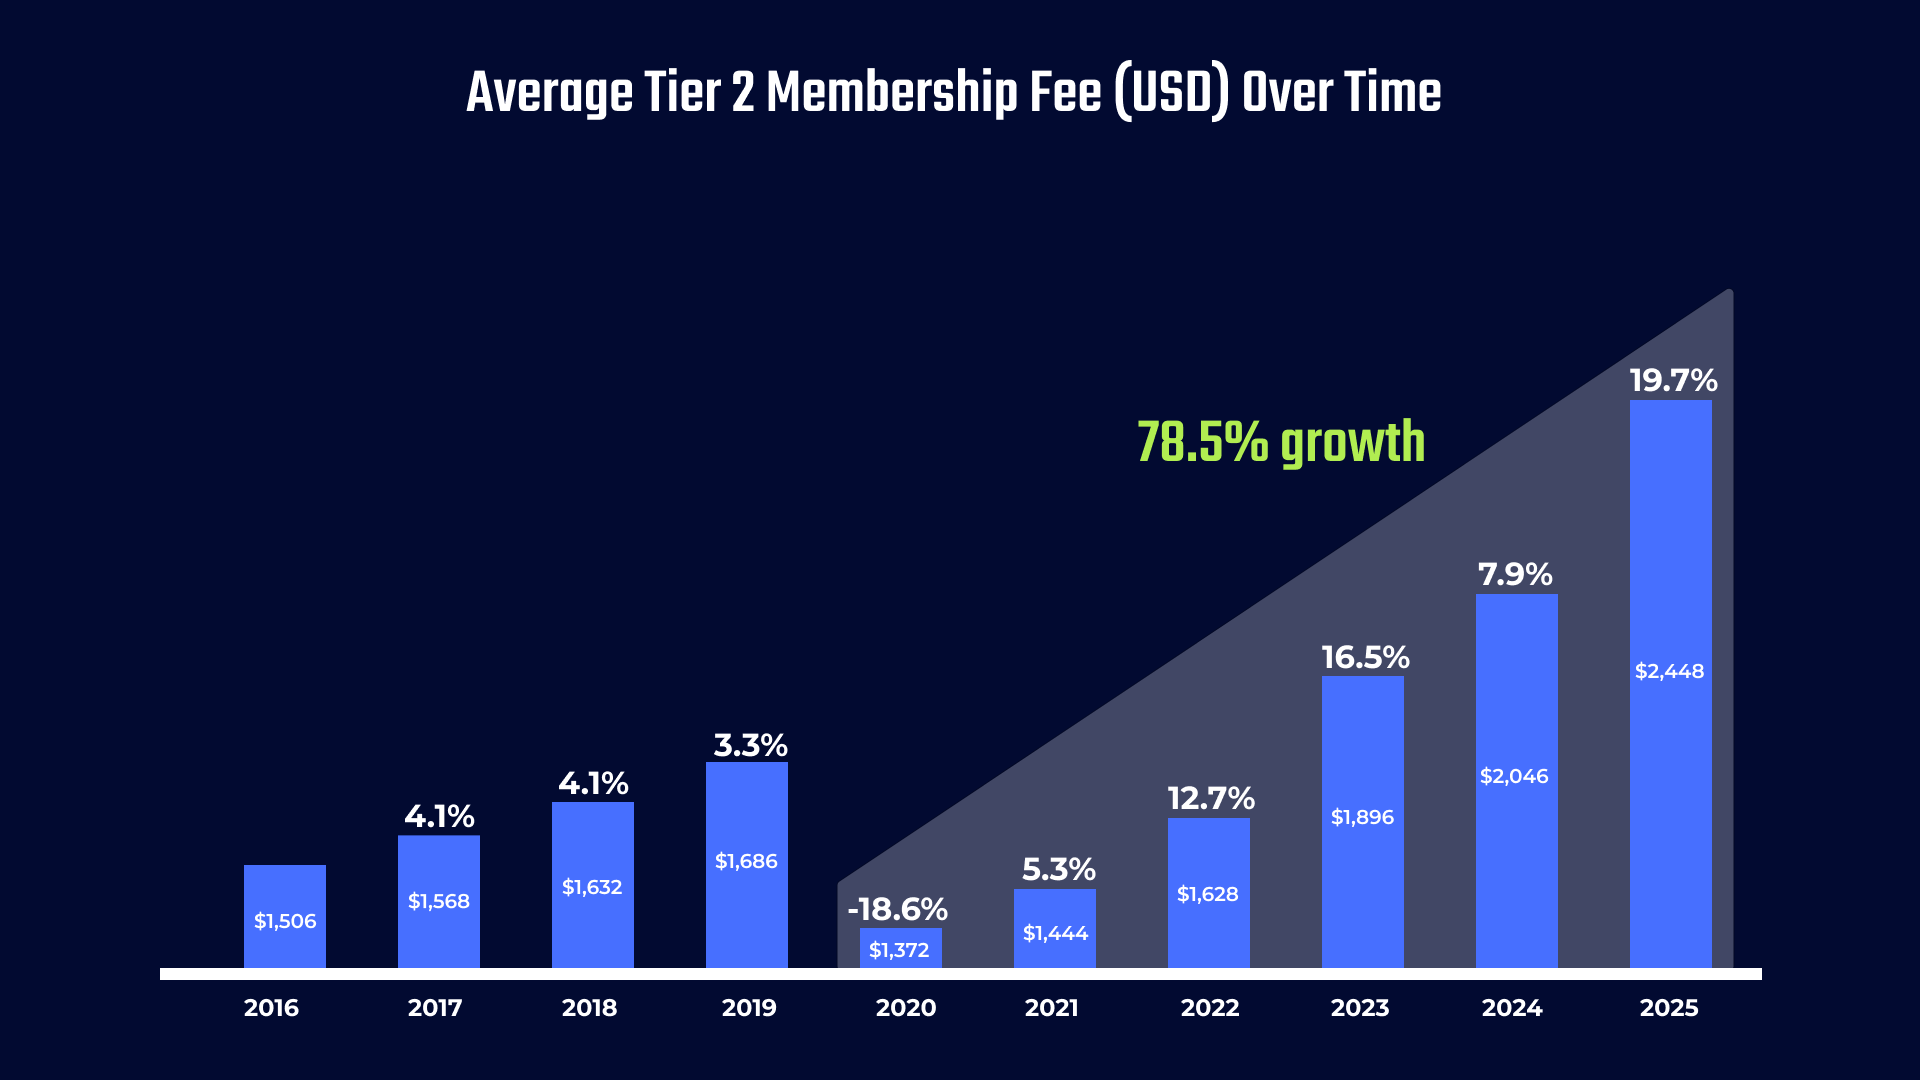
A Look at “Typical” Tier 2 Fees
Tier 2 programs – where most youth hockey athletes play – averaged $2,448 for the 2025 season. These programs represent the primary competitive experience for the majority of travel hockey families. Across the full ten-year dataset, Tier 2 programs averaged $1,964, with a steady increase leading to the current figure.
If you operate both tiers, one question becomes important: Do families see and understand the difference between the two programs, and what drives the higher cost at Tier 1?
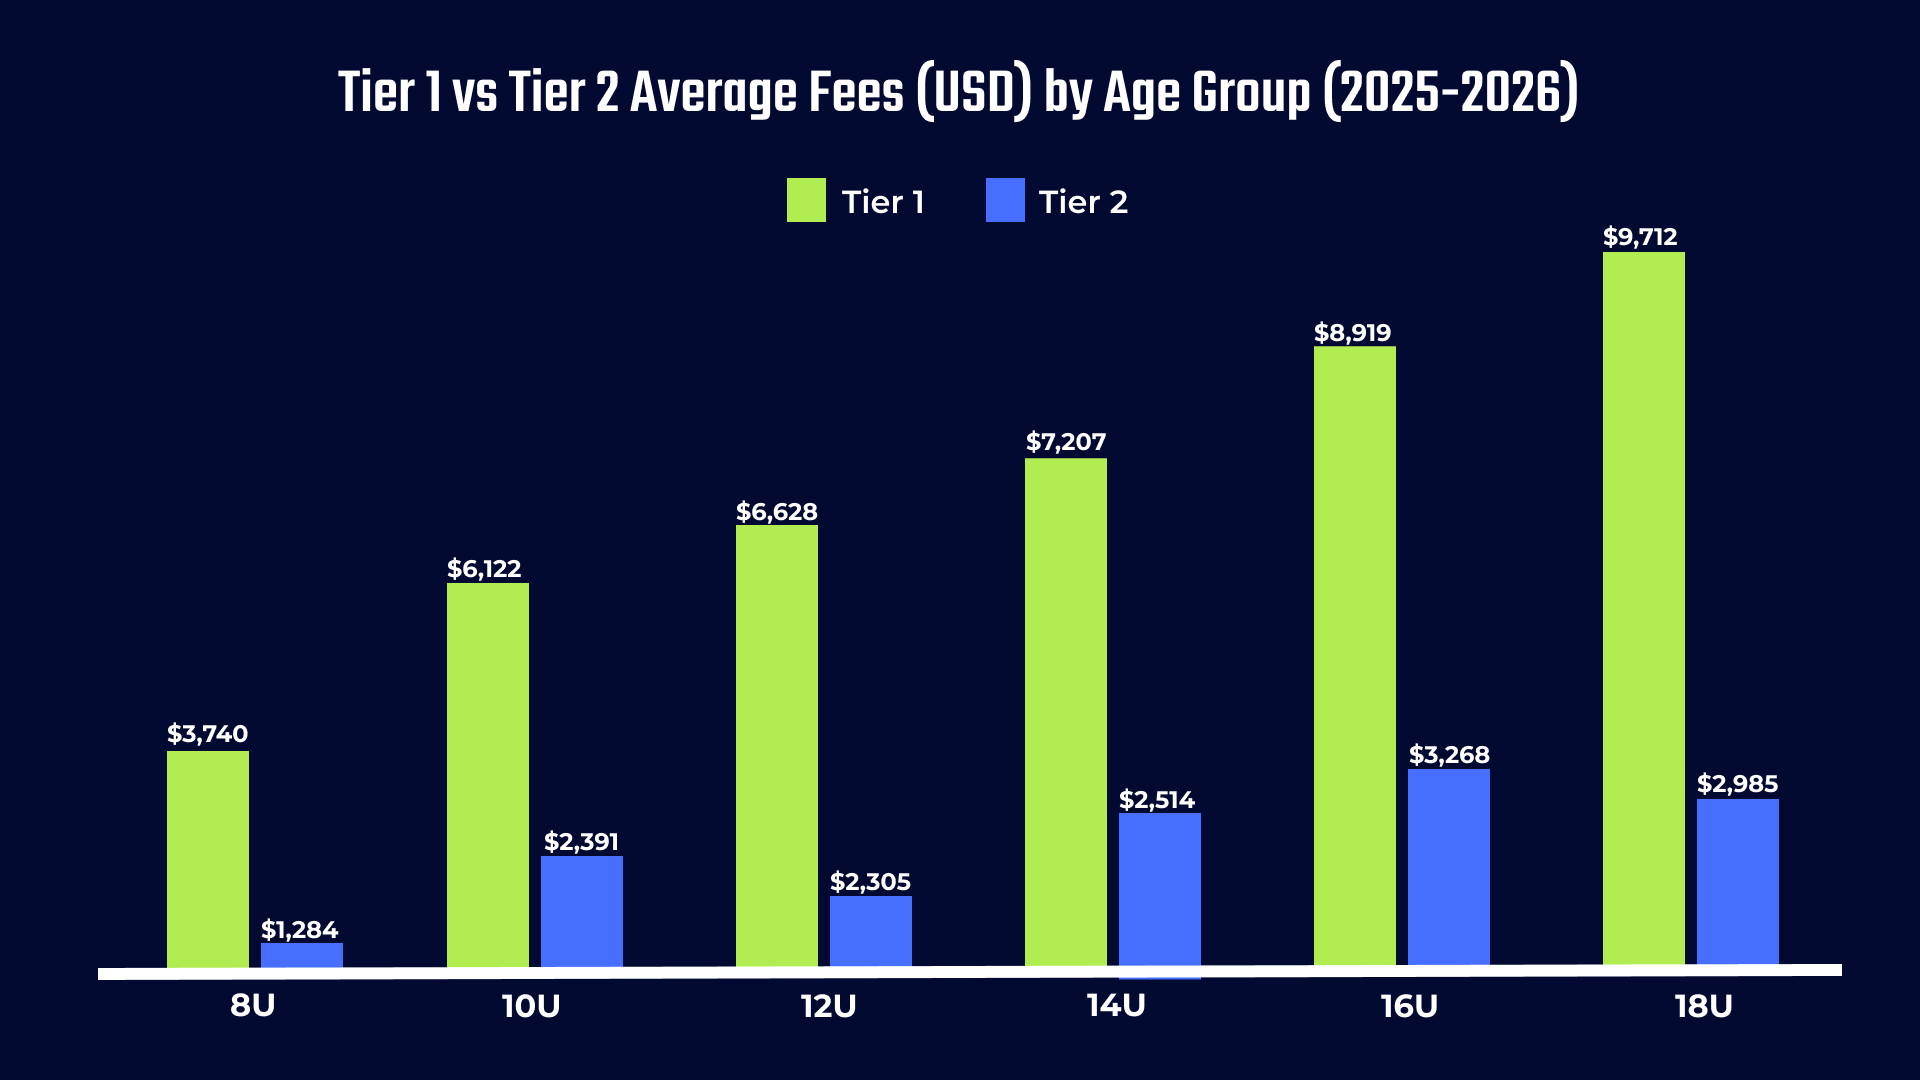
Age Groups: Where Costs Climb (and Why)
If certain age groups feel more expensive, it's because they are. Fees increase as players move through youth hockey, and the data clearly shows that pattern.
In Tier 2, 8U teams average about $1,284, the lowest point in the age ladder.
By
16U, that number more than doubles to
$3,268, the highest average in the dataset.
Fees dip slightly at 18U, but remain well above the younger levels.
This progression aligns with common operational realities: older teams typically skate more, travel more, and participate in higher-level tournaments and events.
Questions you might ask yourself:
- Does your age-by-age pricing ladder follow a similar pattern to others in your area?
- Are your travel, ice time, and tournament expectations aligned with what peers include at each age?
- Are there jumps between age groups that might surprise families or warrant better communication?
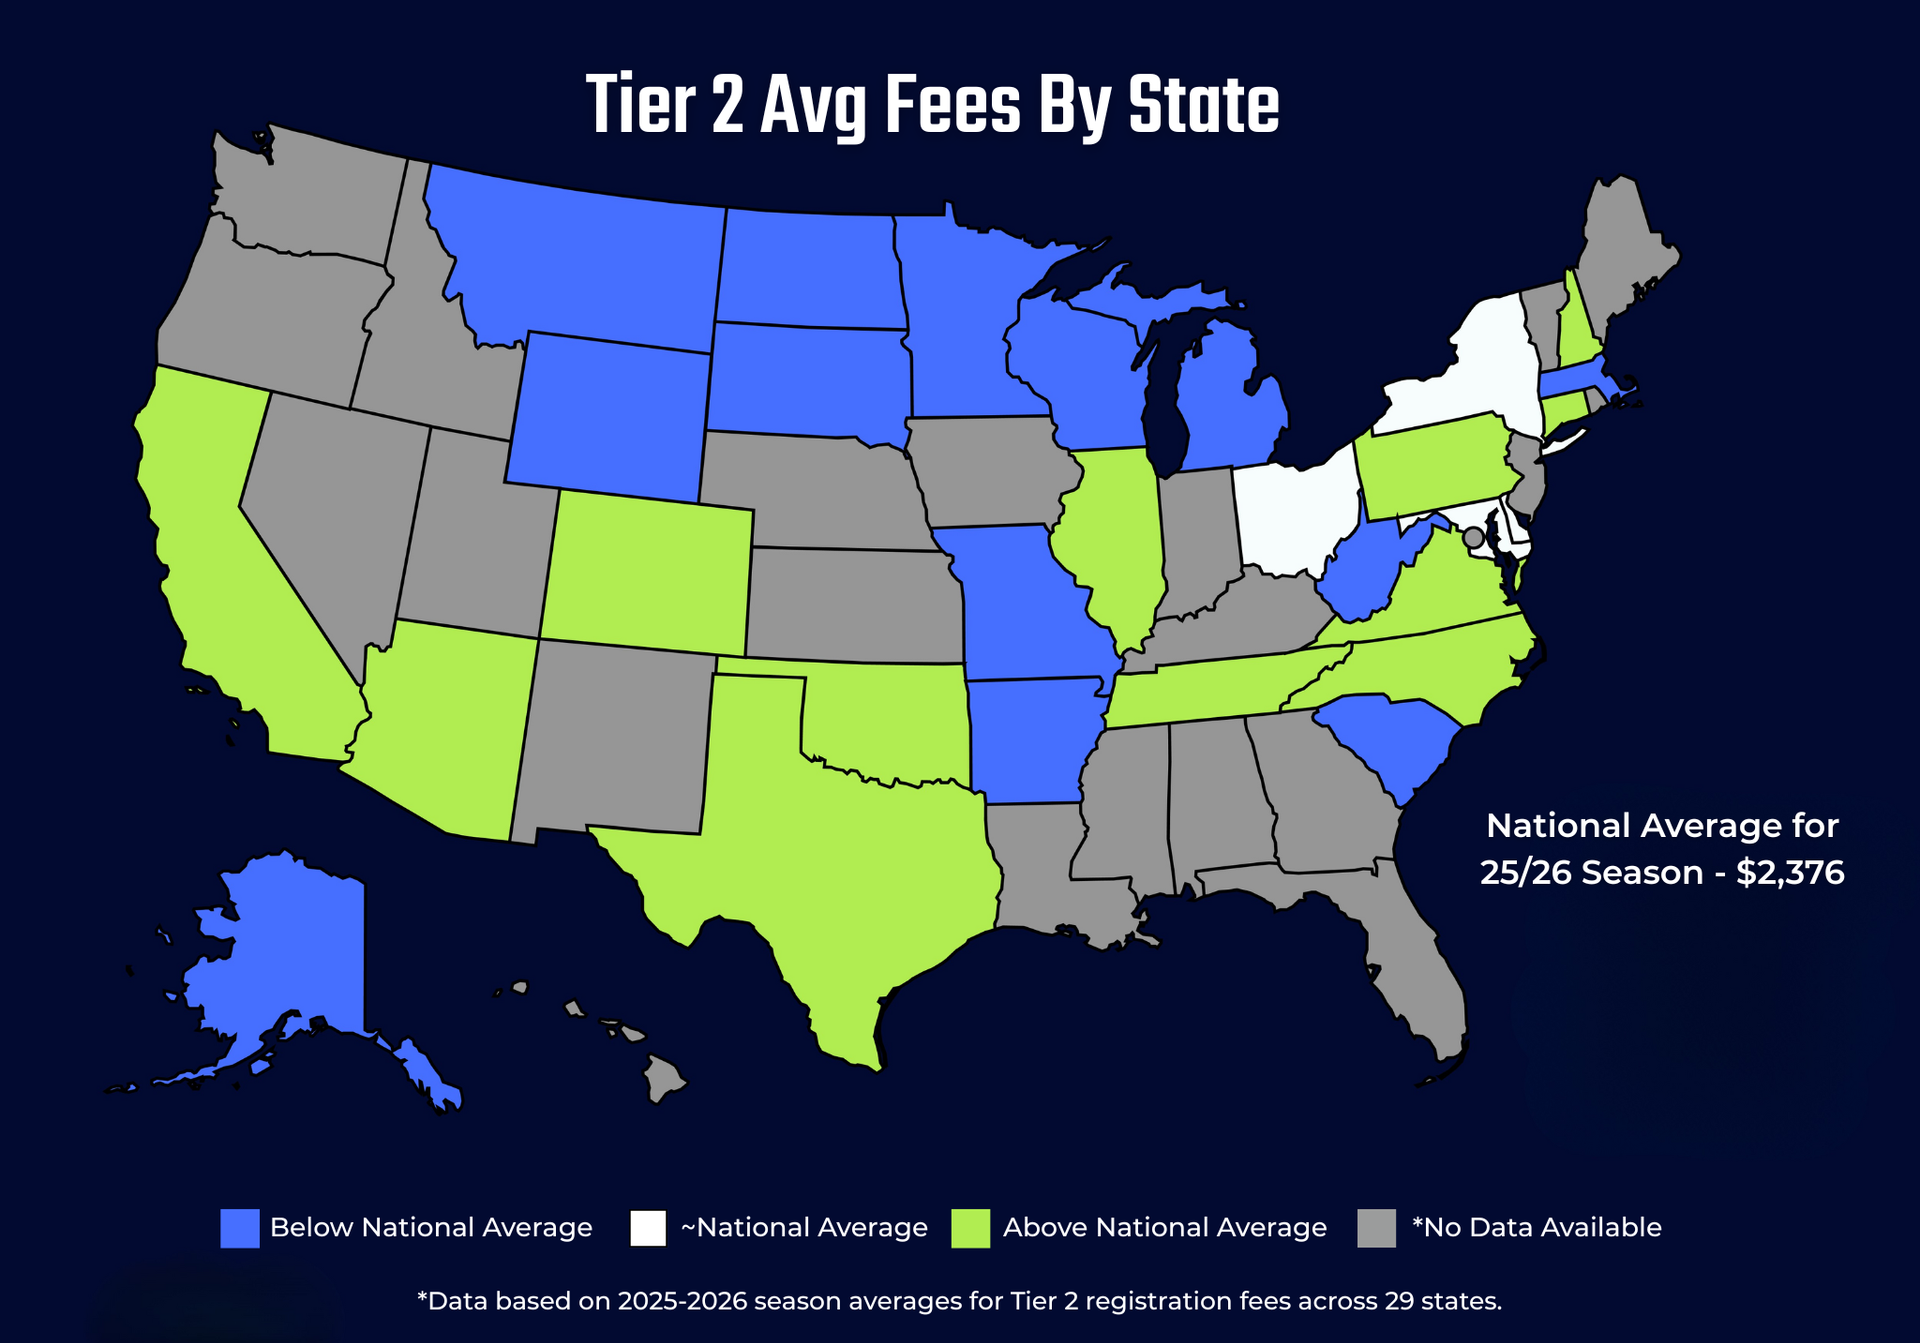
Geography: Where Youth Hockey Hits Hardest
If you assume the highest fees sit in the northern hockey strongholds, the data points elsewhere. In Tier 2 for the 2025–26 season, the top averages show up in the Sun Belt and the East Coast – not the Upper Midwest.
Highest state averages (Tier 2, 2025–26):
- Arizona: ~$5,912
- Tennessee: ~$4,506
- Connecticut: ~$4,498
- Illinois: ~$3,989
- Oklahoma: ~$3,539
Lowest state averages:
- Alaska: ~$450
- South Dakota: ~$595
- West Virginia: ~$810
- Wyoming: ~$890
- North Dakota: ~$946
These ranges are striking. Arizona families pay more than 13 times what Alaska families pay for Tier 2 hockey. These differences reflect underlying structural factors such as facility access, travel requirements, competitive density, market size, and even the local cost of living.
Because of this, national averages often tell only part of the story. State-level patterns – and even more so – district-level patterns tend to offer clearer context.
A Note on USA Hockey Districts
District averages give a clearer sense of costs within similar competitive environments. For example, Pennsylvania spans multiple districts, so looking at district-level numbers can help make more relevant comparisons. They’re often more useful than national averages, as long as you keep sample size in mind.
We’ve created a tool to make it easier to see how your state stacks up when it comes to youth hockey fees. While not every state has available data, this tool aims to provide a clear, visual snapshot of where your state sits compared to others across the country, as well as within your district and nationally.
As you work your way through this tool, ask yourself questions like “How does your age-by-age ladder compare to your state or district's typical pattern?” or “Are there jumps between age groups that might surprise families or warrant better communication?” Use this tool as a way to spark discussion amongst your staff and volunteers.
Final Thoughts: Putting the Data in Context
This data isn’t about prescribing exact fees – it’s about giving your club a clearer lens to see how costs evolve across tiers, ages, and regions. As you consider your own programs, ask yourself: How clearly does your tier structure communicate value? Do your age-by-age fees align with what families might expect? And how does your club compare within your region?
The real value comes from using these insights to guide conversations, support planning, and help families understand the choices behind your programs. By reflecting on these patterns, you can make informed decisions and plan confidently for the seasons ahead.
Data derived from Crossbar registration records across Tier 1 and Tier 2 youth hockey organizations, 2015-2025 seasons. Geographic and age group averages based on available reporting; some state-level data reflect limited sample sizes and should be treated as directional.
Recent Posts